
Page 43 - Fall2011
P. 43
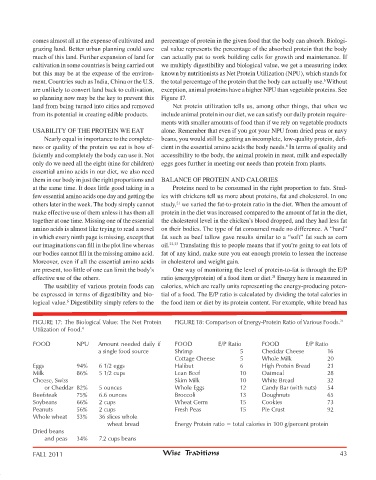
comes almost all at the expense of cultivated and  percentage of protein in the given food that the body can absorb. Biologi-
                grazing land. Better urban planning could save  cal value represents the percentage of the absorbed protein that the body
                much of this land. Further expansion of land for  can actually put to work building cells for growth and maintenance. If
                cultivation in some countries is being carried out  we multiply digestibility and biological value, we get a measuring index
                but this may be at the expense of the environ-  known by nutritionists as net Protein Utilization (nPU), which stands for
                ment. Countries such as India, China or the U.S.  the total percentage of the protein that the body can actually use. Without
                                                                                                                6
                are unlikely to convert land back to cultivation,  exception, animal proteins have a higher nPU than vegetable proteins. See
                so planning now may be the key to prevent this  Figure 17.
                land from being turned into cities and removed     net protein utilization tells us, among other things, that when we
                from its potential in creating edible products.   include animal protein in our diet, we can satisfy our daily protein require-
                                                          ments with smaller amounts of food than if we rely on vegetable products
                USaBIlIty oF the ProteIn We eat           alone. remember that even if you got your nPU from dried peas or navy
                    nearly equal in importance to the complete-  beans, you would still be getting an incomplete, low-quality protein, defi-
                ness or quality of the protein we eat is how ef-  cient in the essential amino acids the body needs.  In terms of quality and
                                                                                                    6
                ficiently and completely the body can use it. Not  accessibility to the body, the animal protein in meat, milk and especially
                only do we need all the eight (nine for children)  eggs goes further in meeting our needs than protein from plants.
                essential amino acids in our diet, we also need
                them in our body in just the right proportions and  BalanCe oF ProteIn anD CalorIeS
                at the same time. It does little good taking in a     Proteins need to be consumed in the right proportion to fats. Stud-
                few essential amino acids one day and getting the  ies with chickens tell us more about proteins, fat and cholesterol. In one
                others later in the week. the body simply cannot  study,  we varied the fat-to-protein ratio in the diet. When the amount of
                                                                21
                make effective use of them unless it has them all  protein in the diet was increased compared to the amount of fat in the diet,
                together at one time. Missing one of the essential  the cholesterol level in the chicken’s blood dropped, and they had less fat
                amino acids is almost like trying to read a novel  on their bodies. the type of fat consumed made no difference. a “hard”
                in which every ninth page is missing, except that  fat such as beef tallow gave results similar to a “soft” fat such as corn
                our imaginations can fill in the plot line whereas  oil. 22,23  translating this to people means that if you’re going to eat lots of
                our bodies cannot fill in the missing amino acid.  fat of any kind, make sure you eat enough protein to lessen the increase
                Moreover, even if all the essential amino acids  in cholesterol and weight gain.
                are present, too little of one can limit the body’s     one way of monitoring the level of protein-to-fat is through the e/P
                effective use of the others.              ratio (energy/protein) of a food item or diet.  energy here is measured in
                                                                                               21
                    the usability of various protein foods can  calories, which are really units representing the energy-producing poten-
                be expressed in terms of digestibility and bio-  tial of a food. the e/P ratio is calculated by dividing the total calories in
                logical value.  Digestibility simply refers to the  the food item or diet by its protein content. For example, white bread has
                           6

                FIGURE 17: The Biological Value: The Net Protein   FIGURE 18: Comparison of Energy-Protein Ratio of Various Foods. 21
                Utilization of Food. 4

                FOOD          NPU     Amount needed daily if    FOOD         E/P Ratio      FOOD          E/P Ratio
                                      a single food source     Shrimp                5      Cheddar  Cheese      16
                                                               Cottage Cheese        5      Whole Milk           20
                Eggs          94%     6 1/2 eggs               Halibut               6      High Protein Bread   21
                Milk          86%     5 1/2 cups               Lean Beef             10     Oatmeal              28
                Cheese, Swiss                                  Skim Milk             10     White Bread          32
                    or Cheddar  82%   5 ounces                 Whole Eggs            12     Candy Bar (with nuts)   54
                Beefsteak     75%     6.6 ounces               Broccoli              13     Doughnuts            65
                Soybeans      66%     2 cups                   Wheat Germ            15     Cookies              73
                Peanuts       56%     2 cups                   Fresh Peas            15     Pie Crust            92
                Whole wheat   53%     36 slices whole
                                         wheat bread           Energy Protein ratio = total calories in 100 g/percent protein
                Dried beans
                    and peas   34%    7.2 cups beans

 Wise Traditions   FALL 2011  FALL 2011                    Wise Traditions                                           43


         82725_WAPF_Txt.indd   43                                                                                    9/15/11   2:01 PM